Class 10 Statistics Previous Year Questions
Q1:
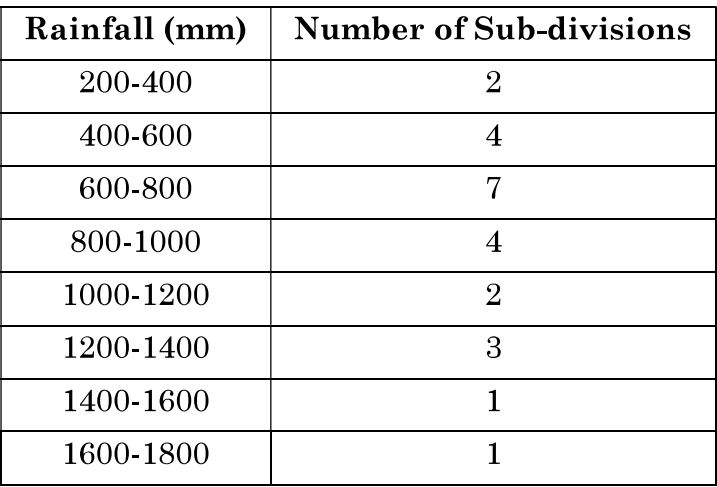
Inidia meteorological department observes seasonal and annual rainfall every year in different sub-divisions of our country. It helps them to compare and analyse the results. The table given above shows sub-division wise seasonal(monsoon) rainfall (mm) in 2018. Based on the above information, answer the following questions: (i) Write the modal class. (ii) Find the median of the given data. OR Find the mean rainfall in this season. (iii) If sub-division having at leas 1000 mm rainfall during monsoon season, is considered good rainfall sub-division, then how many sub-divisions had good rainfall ?
CBSE [2023]
MediumQ2:
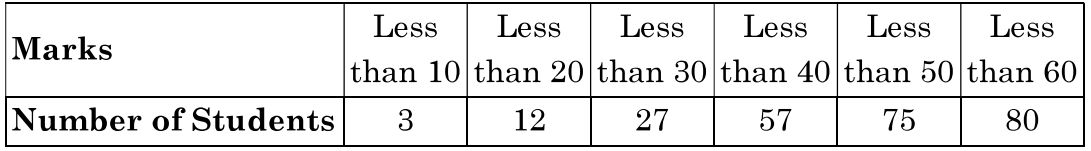
The distribution above gives the marks obtained by 80 students on a test. The modal class of this distribution is:
CBSE [2023]
EasyQ3:
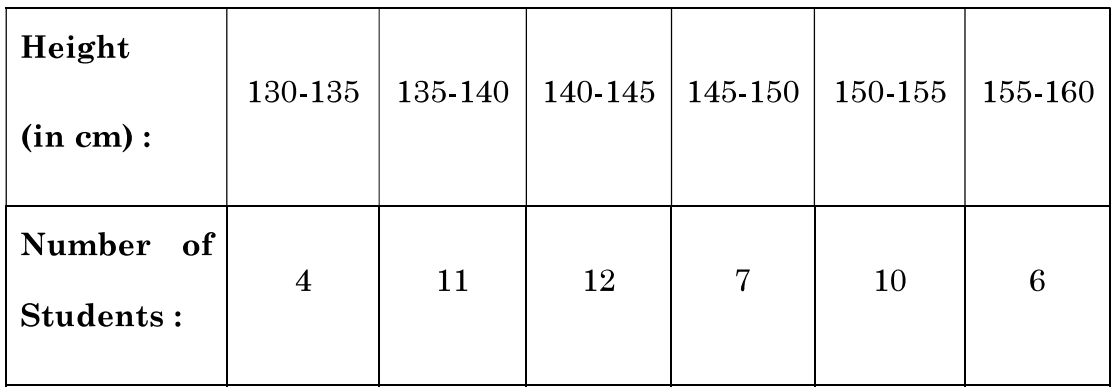
Heights of 50 students of class X of a school are recorded and above data is obtained. Find the median height of the students
CBSE [2022]
EasyQ4:
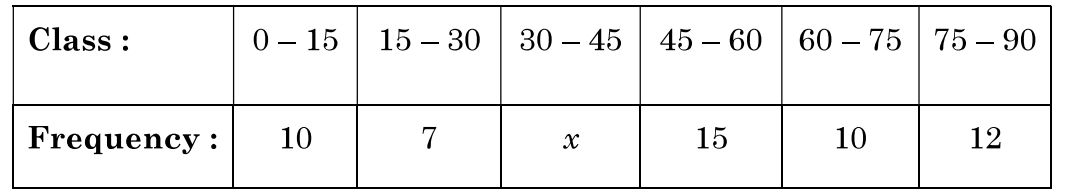
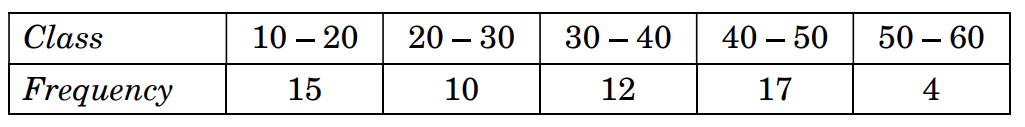
If the mode of the following frequency distribution is 55, then find the value of x.
CBSE [2022]
EasyQ5:
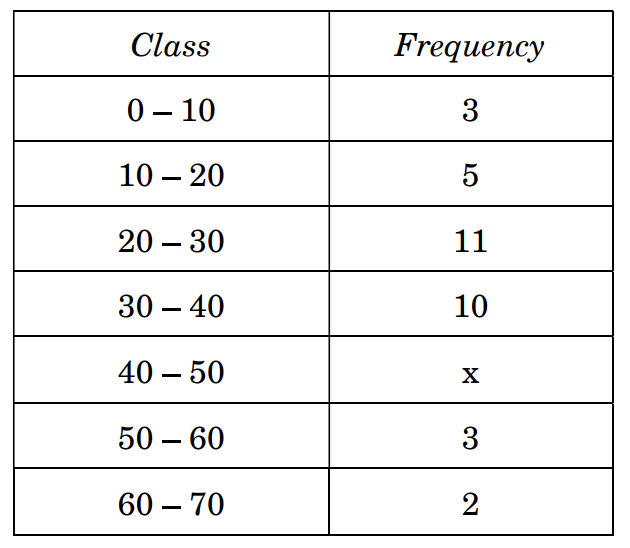
For what value of x, is the median of the following frequency distribution 34·5 ?
CBSE [2022]
EasyQ6: